manual.opvizor
Configure Alerting (or Notification Channel)
It is a good idea to set alerts in certain situations. Examples would be, when you have exceeded a threshold such as the number of snapshots or the amount of memory consumed.
Specific alerts can only to be set on any dashboard graph panel using the Alert tab widget. You must save the Alert to the dashboard to continue using it in the future. See
To configure an method of alerting, configure a notification channel first:
- Go to Alerting > Notification channels.

The Edit Channel dialog appears.
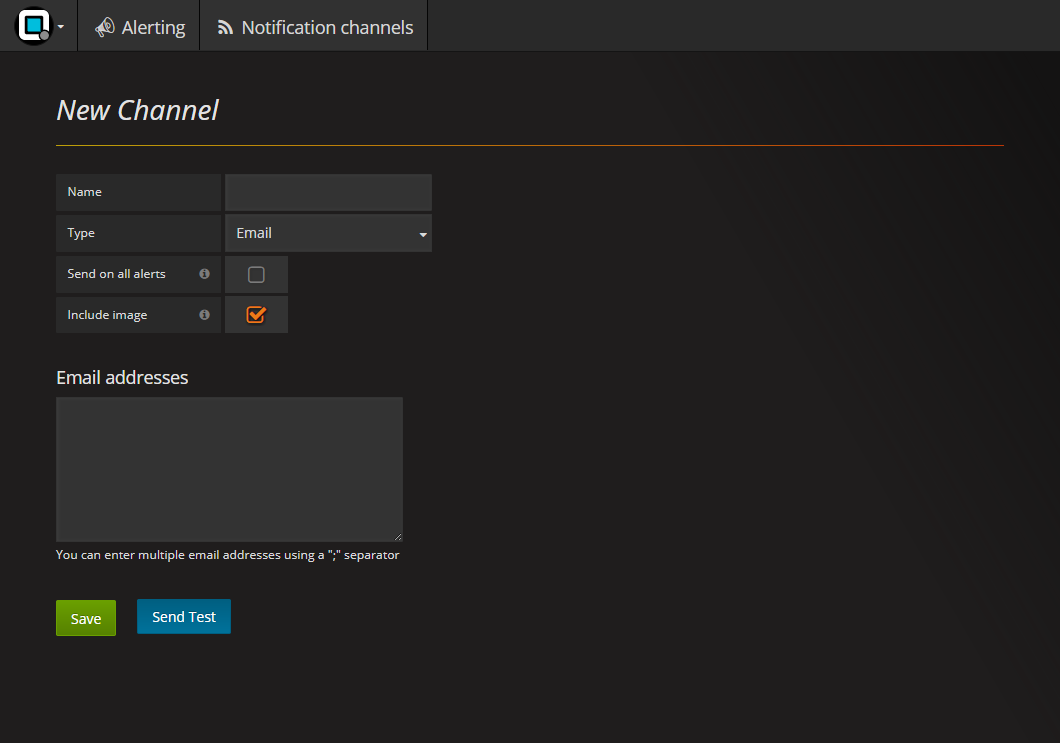
- Enter a Name for the alert
- Enter a Email address. You can enter multiple emails addresses by entering a ; between email address.
- You can opt to send an image of the alert and whether or not to send on all Alerts.
- Click Send Test to send a test.
- Click Save.
Configuring an Alert (on a Graph Panel)
Alerts must be configured to act on the data within an individual graph panel of a dashboard. To set and alert on a panel:
- Open the desired Dashboard.
- Click the desired panel. A dialog appears.
- Click Edit or the Menu icon in the bottom left of the
dialog. A screen appears with the panel you selected at the top and
an Graph panel below with the Graph > General tab
displayed.
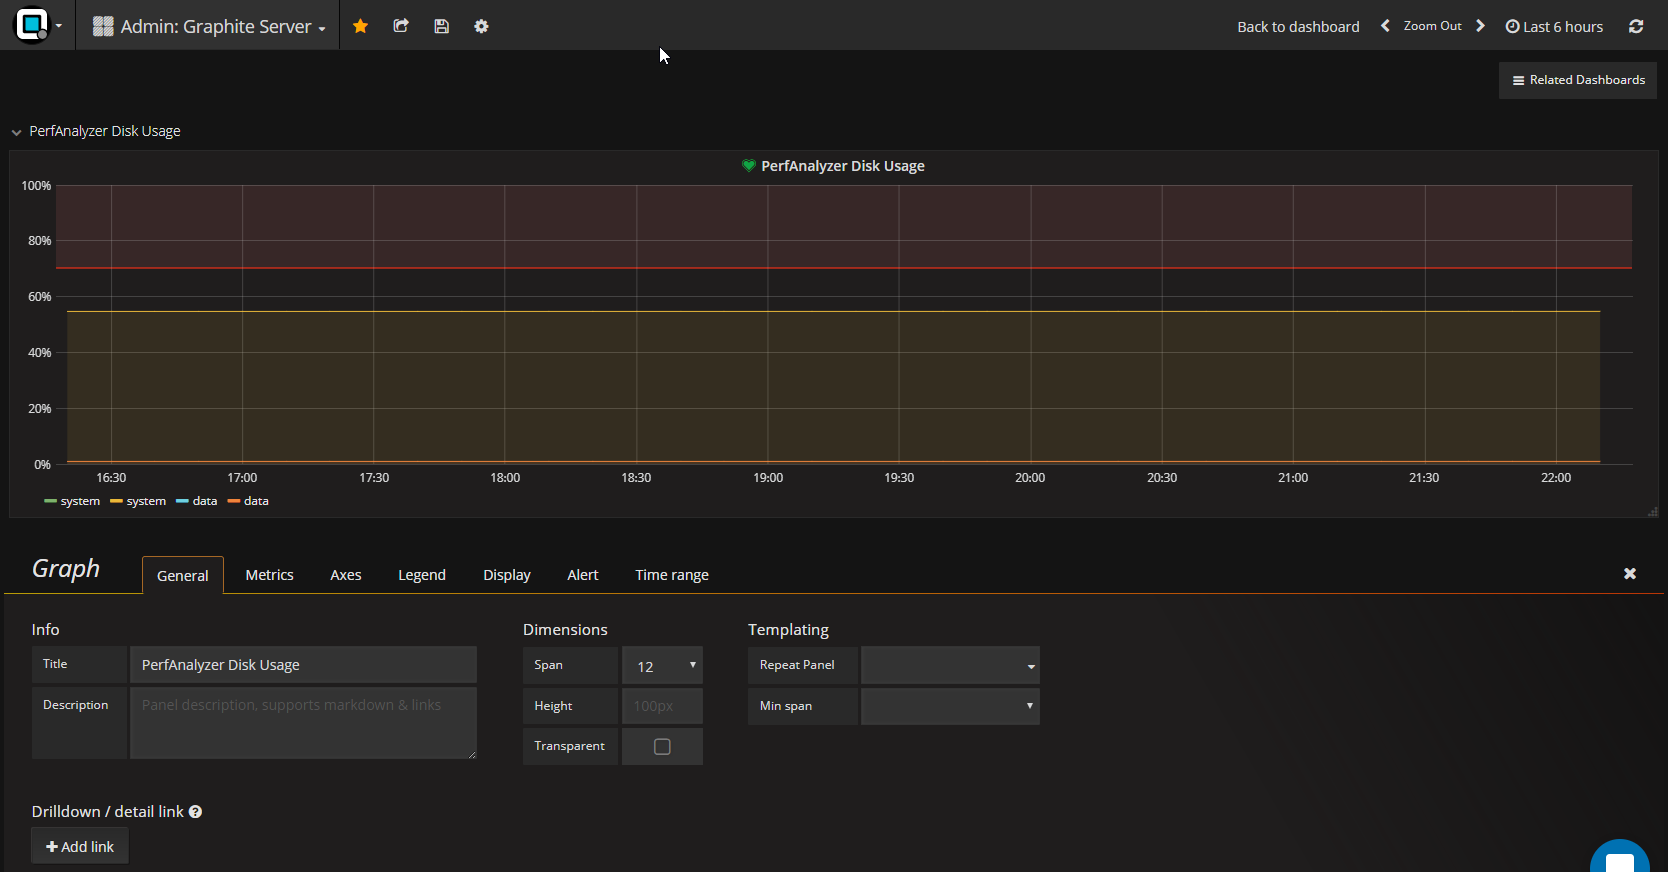
- Click the Alert tab.
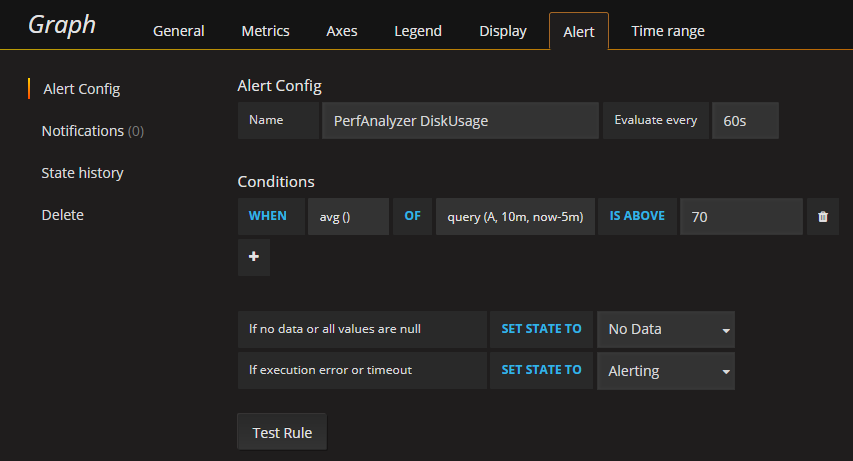
- Adjust the Evaluate Every time and Conditions. See the Grafana Alerting Engine & Rules Guide at http://docs.grafana.org/alerting/rules/
- Click Test Rule.
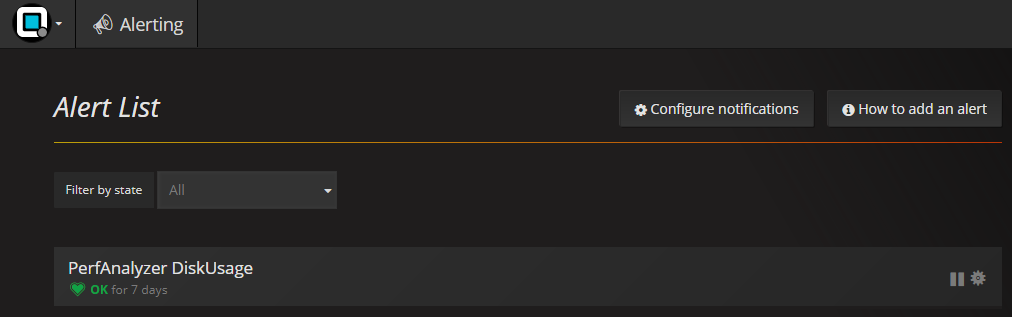
- You can now see if there are any alerts by navigating to Alerts >
Alert List.