manual.opvizor
FAQ
Problem
I don’t see recent data but data from some hours ago.
Reason
That´s a very common sign of a wrong time of the Performance analyzer appliance. That also means that the ESXi host time the appliance runs on is wrong.
Solution
The Performance Analyzer appliance contains and runs VMware Tools configured for time synchronization with the ESXi host.
Therefore, a wrong time of the appliance is a typical sign of a wrong time on the ESXi host. Please check your ESXi hosts time and NTP settings and adjust it. It makes sense to restart the Performance Analyzer appliance.
Problem
There is no new data in the dashboards anymore and most charts are empty
Reason
Disk Space is full
Solution
If the system partition is close or at 100% please let increase
the size of the first virtual disk of the Performance Analyzer
appliance. There is no need to shutdown the appliance, as we auto-resize
the partition within 5 minutes.
If the data partition is close or at 100% please let increase the size of the second virtual disk of the Performance Analyzer appliance. There is no need to shutdown the appliance, as we auto-resize the partition within 5 minutes.
Problem
VMware dashboards suddenly stop to show new data
Reason
VMware vCenter user credentials have changed
Solution
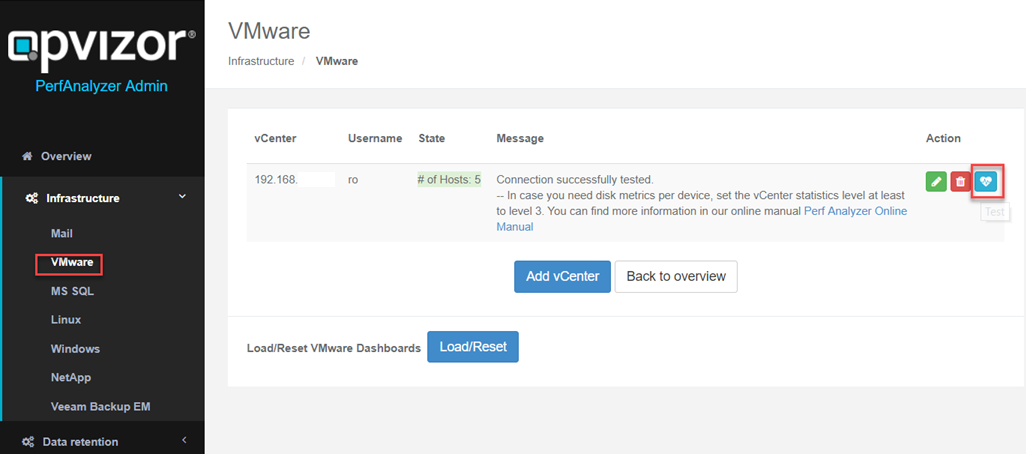
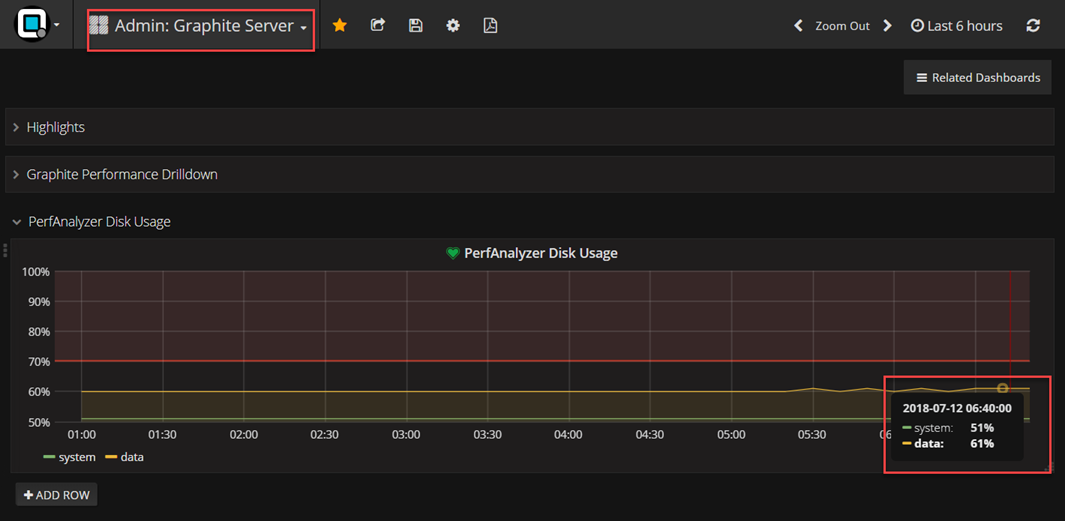
Please check if the vCenter connection is still working (Admin Web
Interface / http://appliance-ip/admin) and a green state including the
number of ESXi hosts is shown. You can click the test button to
re-test the connection. Use the edit button to set the new password.
If the vCenter has been renamed, you can change that the same way
Problem
random gaps in graphs, lasting between 5 minutes and several hours
Reason
There are three main causes, which can be responsible for the problem:
- Generally too slow storage - Opvizor recommends to use only flash storage
- Noisy neighbors imposing high load to the storage at random time
- To few main memory to handle the size of your infrastructure
The gaps are the result of the appliances automatic mitigation for this situation: Whenever the timeseries databases get unresponsive due to too much outstanding IOPS, they will be restarted, purging the unhandled transactions.
Solution
You can improve the situation either by moving the appliance to faster storage, reduce noisy neighbors or increase the appliance memory to have the time series databases in the OS disk cache.
Some words on the latter: Since retention data is calculated before writing metrics to disk, the time series databases need to do a lot of reads, to gather all data for updating the samples in the higher retentions. As long as the OS cache is big enough, these IO won’t hit the storage, so there is only the write IO, which will go to storage.
But when the OS disk cache is even slightly smaller than the time series database working set, the cache will get continuously revolved on each crawler run. So in case you suffer from that continuous revolving, you should increase the appliances memory, until the OS disk cache is big enough.
Some hints for sizing the appliance memory and observing the IOPS:
-
Open the dashboard “VMware Performance: VM”, select 3 hour interval, and choose your Performance Analyzer VM. Then scroll down and open the row “vDisk Metrics”. If there are more Read IOPS then Write IOPS you should try the following procedure:
-
Determine the time series database footprint:
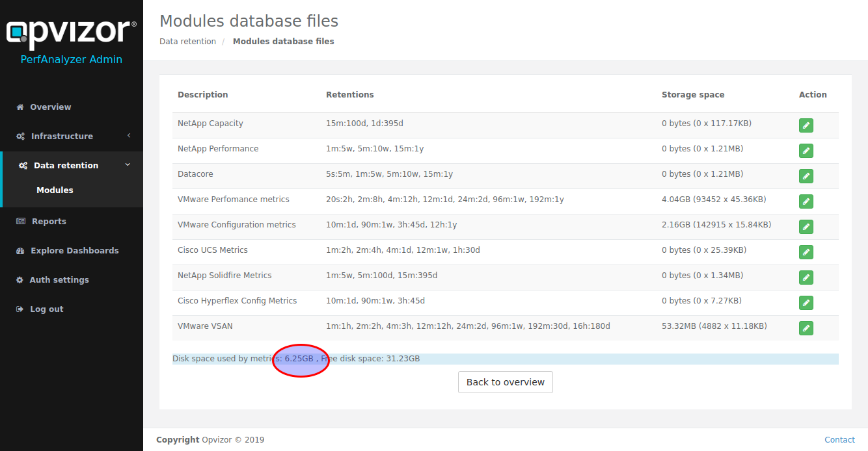
- in this example, we have a footprint of 6.25 GB for the raw metrics. Since there are also other databases for meta-data and OS-metrics, a good starting point for sizing memory would be to almost double that amount - so in this example we would start at 12 GB main memory.
- After changing the memory size and rebooting, give the appliance about 45 minutes, before doing the following check:
-
Open the dashboard “VMware Performance: VM”, select 3 hour interval and choose your Performance Analyzer VM. Scroll down and open the row “vDisk Metrics”:
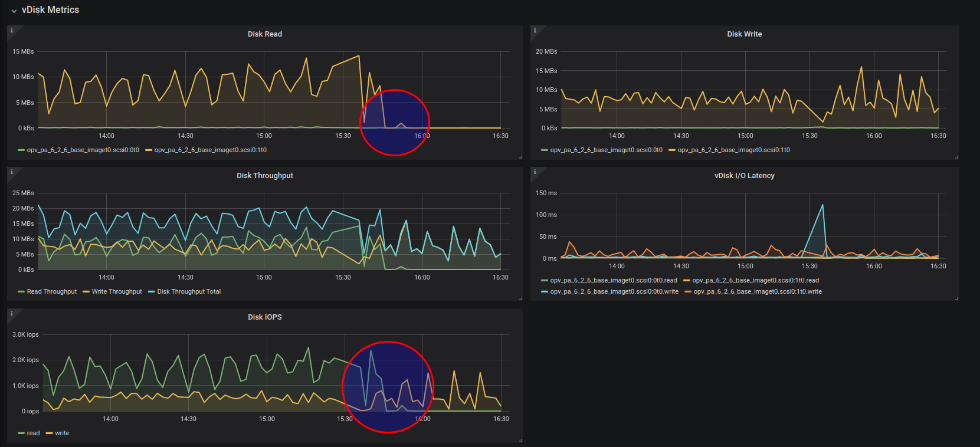
In this example you see an appliance which got memory doubled at 15:30 and was powercyled for that. Everything before 15:30 shows the appliance running with to few memory, leading to continuous cache revolving and lots of disk reads. After 15:30 the cache is big enough. It fills within about 15 minutes after reboot, then read IO drops nearly to zero.
When the main memory is chosen big enough, you will see almost no Disk Reads. Also read IOPS will almost vanish. Disk Write and Write IOs will be swinging more, with a slight increase of the mean value. This is because of the much eager write back performance, so the likelihood for a block to be written several times in the cache before eventually getting written to disk sinks. However, overall you should see a massive reduction of the IO footprint, when main memory is big enough.